

In the mid-1800s, a time prior to the germ theory of disease, the practice of medicine was more often a game of chance and luck than it was an exercise in knowledge and science. Sometimes patients got better and sometimes patients got worse. Sometimes illness spread while other times it stayed contained. Regardless of the outcome, thoughtful and convincing rationale always accompanied each case. Whether it was the moral failings of women who succumbed to childbed fever or the wickedness of the townsfolk who lived in villages plagued with cholera, medicine prior to germ theory was always able to explain the outcome. Medicine was practiced “successfully” even though successful practice contained no knowledge of the invisible world of germs and other microorganisms that caused and spread disease.
The virus of variation
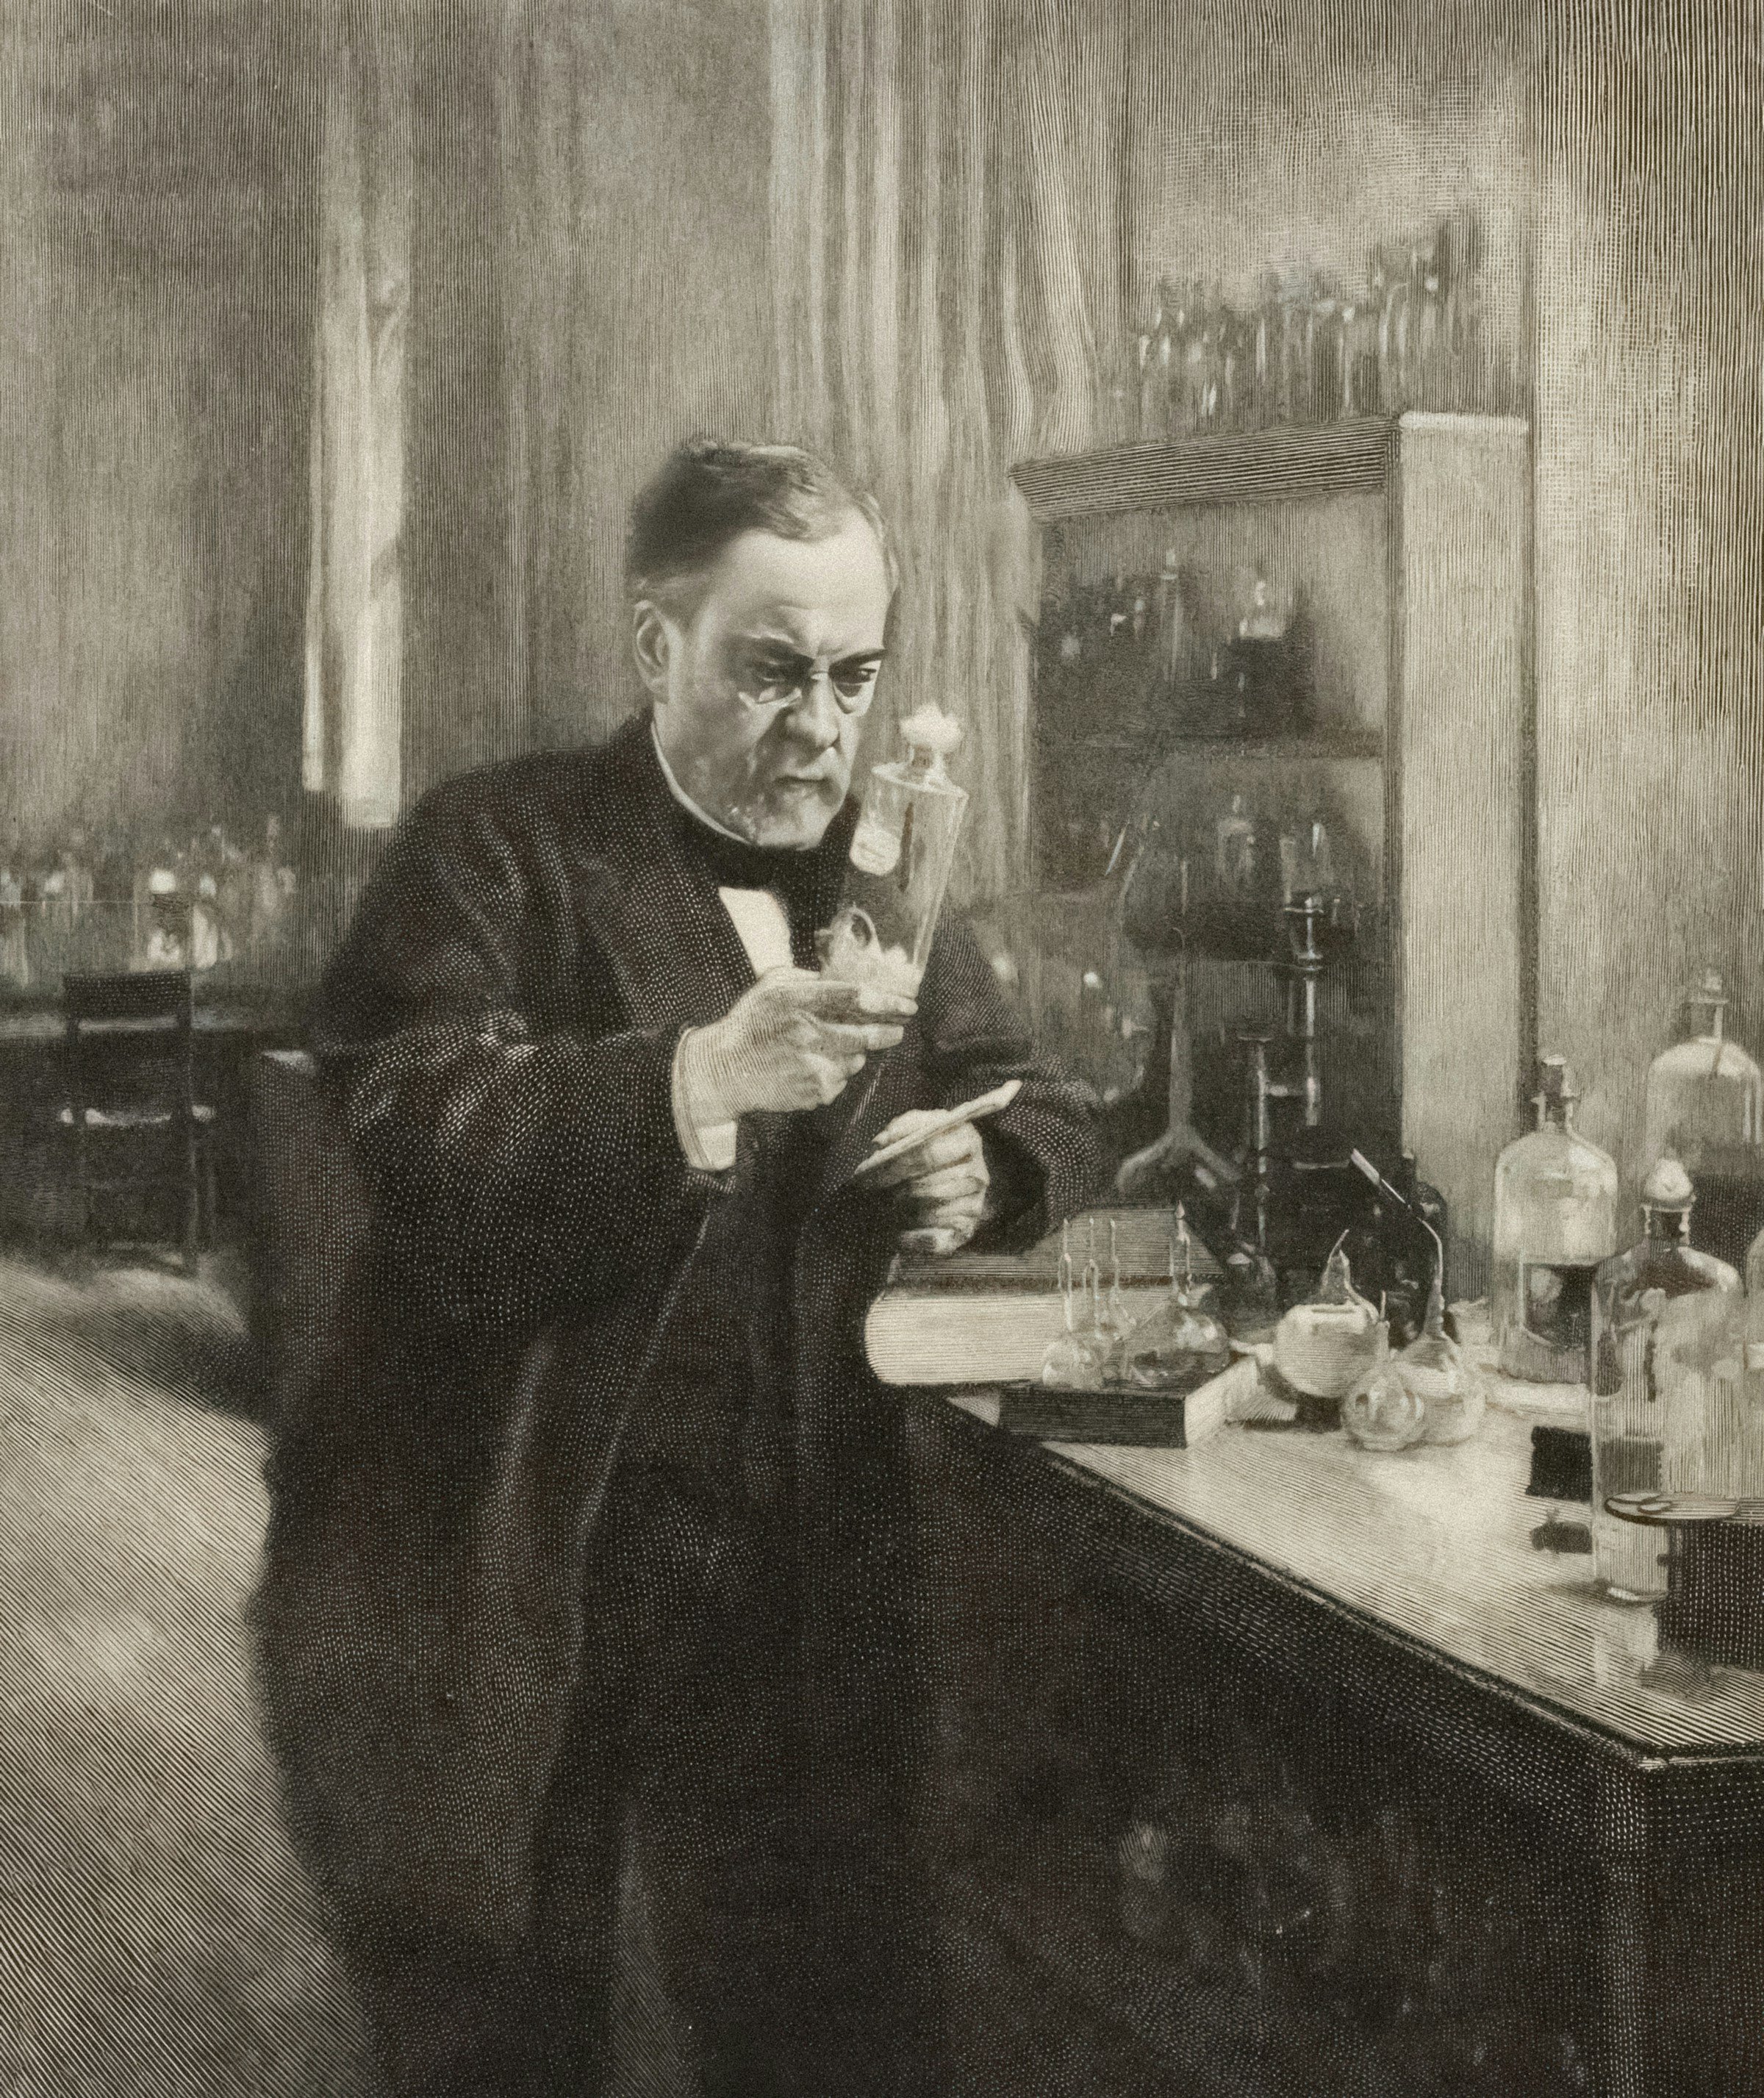
Fig 2: Portrait of Louis Pasteur in his laboratory
This all changed, however, with the work of French chemist Louis Pasteur. It was Pasteur who, through a series of experiments in the mid-to-late 1800s, showed that germs, not the “ill-defined emanation from rotting organic matter” called miasmas, were the cause of disease. It was Pasteur who, through making the invisible world of microorganisms visible, brought forth a revolution in the practice of medicine. No longer would the treatment of illness be left to chance or the whims of a great deity. No longer would towns be ravaged by the unrelenting and unimpeded spread of disease. Medicine would now be practiced successfully by integrating the knowledge that was revealed by Pasteur’s work and the germ theory of disease.
While the plight of medicine and society prior to germ theory may seem laughable, it is in many ways reflected in the practice of business and industry today. For better or for worse, the work of management, leadership, engineers, designers, manufacturers, technicians, and teams sometimes makes things better and sometimes makes things worse. As was the case for the world prior to the establishment of the germ theory of disease, genuine rational always accompanies outcomes. When things go south, blame is placed on suppliers for their lack of quality and technicians are blamed for cutting corners or not following work instructions. When things go well, praise, accolades, and, most importantly, money are bestowed unto those who assert that their experience and wisdom are the root cause of success. Like the pre-germ theory miasma governed world, management is practiced “successfully” even though accepted practice fails to incorporate the germ theory of manufacturing and management. It fails to incorporate knowledge of the virus of variation and its very real but reliably overlooked effects.

Fig 1: Cholera tramples the victors and the vanquish’d both, Robert Seymour, 1831
“Planning requires prediction.”
— W. Edwards Deming, Out of the Crisis
Shewhart & the two types of variation
In the same way that Pasteur established the foundations upon which our understanding of germs and germ theory is built, so too did Dr. Walter Shewhart, in the mid-1920s, establish the foundation upon which our understanding of the virus of variation and the germ theory of manufacturing and management is built. It was Shewhart who, through his work at Bell Labs, revealed that variation was a relentless force that asserted influence on all manufacturing processes. It was Shewhart who, through revealing variation’s relentless influence, established that, as summarized by Donald J. Wheeler on page 4 of Understanding Statistical Process Control,
“While every process displays variation, some processes display controlled variation, while other processes display uncontrolled variation.”
This distinction between controlled variation and uncontrolled variation is the fundamental finding of Shewhart’s work at Bell Labs. It is from this finding that our understanding of the virus of variation emerged and with it the development of the only tool capable of discriminating between the two types of variation— the process behavior chart.
Controlled variation, what we will refer to as common causes of routine variation, is an innate and intrinsic feature of all processes. A product of what Shewhart called “Chance Causes”, processes influenced by only common causes of routine variation display a consistent pattern of variation over time. An idealized example of this pattern is shown in Figure 3. Here, the quality characteristic for a series of discrete parts produced by the same process but measured on different days is shown. The consistency of the distribution from day-to-day regarding its shape, center, and spread, indicates that differences in these parts are the product of only common causes of routine variation. They are the product of the to-be-expected variation that is an innate and unavoidable feature of making things.

Fig 3: Idealized concept of routine (controlled) variation
Uncontrolled variation, what we will refer to as assignable causes of exceptional variation, are an extrinsic and unexpected feature of process behavior. A product of what Shewhart called “Assignable Causes,” processes influenced by assignable causes of exceptional variation display patterns of variation that are inconsistent over time. A characterization of this pattern of variation is shown in Figure 4. Here, the quality characteristic for a series of discrete parts produced by the same process but measured on different days is shown. The inconsistency of the distribution from day-to-day regarding its shape, center, and spread, the way it erratically shifts, expands, and contracts, indicates that differences between parts are the product of both common causes of routine variation and assignable causes of exceptional variation. Although assignable causes are few in number they are dominant in their effect. Thus, the presence of assignable causes masks the routine variation and ensures future process behavior cannot be predicted within limits.

Fig 4: Characterization of exceptional (uncontrolled) variation
Since, at its core, management is prediction, the influence of assignable causes of exceptional variation on process behavior makes the job of management impossible. It reduces the job of management to gut feelings and guesswork. While even a broken clock is right twice a day, the improvement of quality and reduction of costs requires a more robust, repeatable, and formal method. Recognizing this, and having established the distinction between the two types of variation, Shewhart set to work in an effort to build a tool capable of discriminating between the two types of variation. The result was the process behavior chart—what Shewhart called a control chart.