

Looking to improve quality & reduce costs of manufacturing?
UNDERSTANDING VARIATION IS THE ANSWER!
“A phenomenon will be said to be controlled [predictable] when, through the use of past experience, we can predict, at least within limits, how the phenomenon will behave in the future.”
— Walter A. Shewhart, Economic Control of Quality of Manufactured Product

-
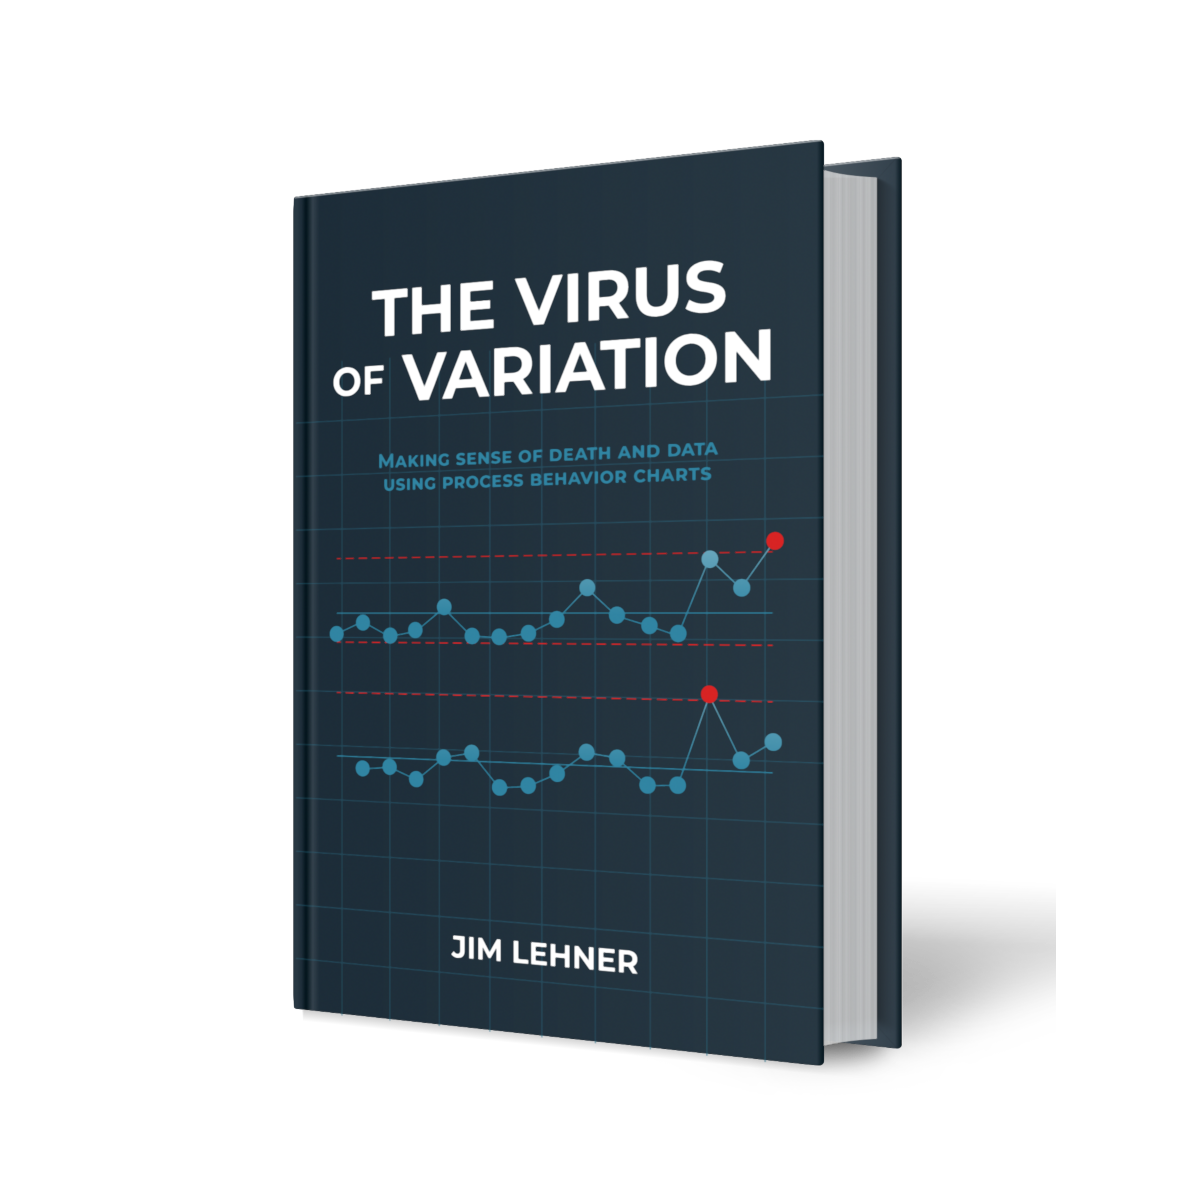
Using the story of the 19th-century Hungarian physician Ignaz Semmelweis as a guide, The Virus of Variation teaches readers how to make sense of data using process behavior charts (control chart). By investigating the death-to-birth rates at Vienna General Hospital, the story of Semmelweis reveals the value of understanding variation and the mechanisms by which business and industry can diagnose and treat it.
Some of the topics covered include:
The importance of context when interpreting data
How to build a process behavior chart (control chart)
How to characterize process behavior
The right (and wrong) way to calculate process limit
The principles of process improvement
Much more!
Stop relying on luck to improve your processes and systems. Start making sense of data by using process behavior charts to understand variation!
Data has become the currency of our time, yet few know what to do with it. This has led to confusion about what constitutes a signal and what constitutes noise. It has spawned tools and techniques that promise to improve quality and reduce costs, but their promise is never fulfilled. Things do not need to be this way. Deference to inferior methods does not have to be the norm. A solution to this problem is within reach!
Using the story of the 19th-century Hungarian physician Ignaz Semmelweis as a guide, The Virus of Variation teaches readers how to make sense of data using process behavior charts (control chart). By investigating the death-to-birth rates at Vienna General Hospital, the story of Semmelweis reveals the value of understanding variation and the mechanisms by which business and industry can diagnose and treat it.
Some of the topics covered include:
The importance of context when interpreting data
How to build a process behavior chart (control chart)
How to characterize process behavior
The right (and wrong) way to calculate process limit
The principles of process improvement
Much more!
Stop relying on luck to improve your processes and systems. Start making sense of data by using process behavior charts to understand variation!
Variation Is Costing You More Than You Think
Every defect, delay , and rework event in your operation has a root cause— and it’s almost always a product of uncontrolled process variation.
Scrap & Rework Costs
Uncontrolled variation produces out-of-spec parts — a direct, measurable hit to your margins.
Quality Escapes
Uncontrolled variation sends defects to customers, damaging trust and triggering costly returns.
Erratic throughput
Unpredictable processes make scheduling, capacity planning, and on-time delivery nearly impossible.
Firefighting Culture
Without a data-driven, repeatable framework, teams react to noise instead of signals.
A tried and true solution to the problem of variation can help you start reducing costs and improving quality today!
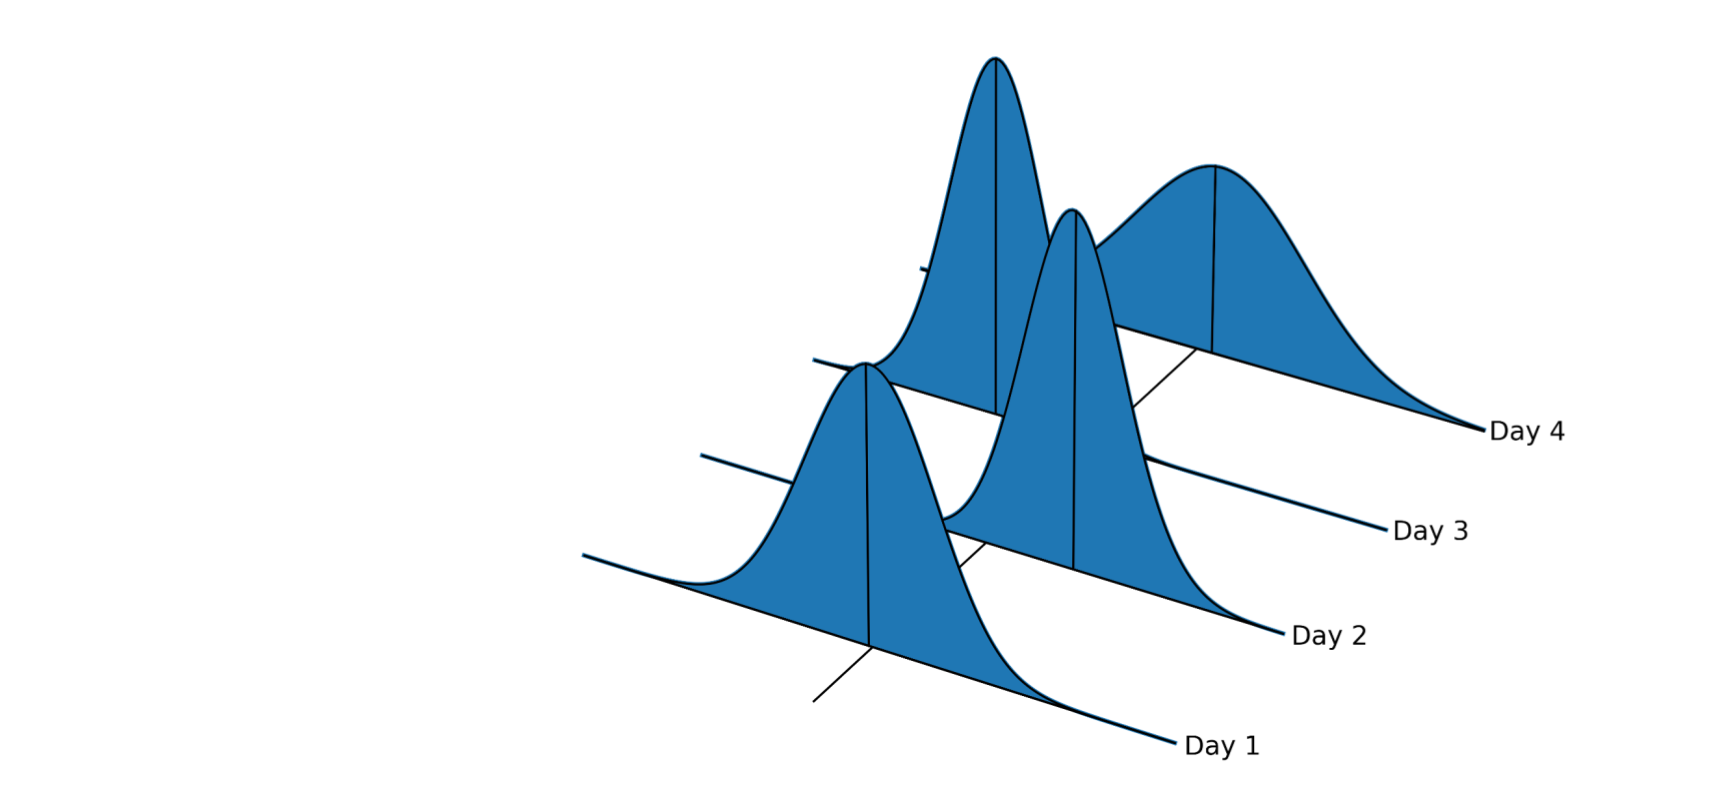
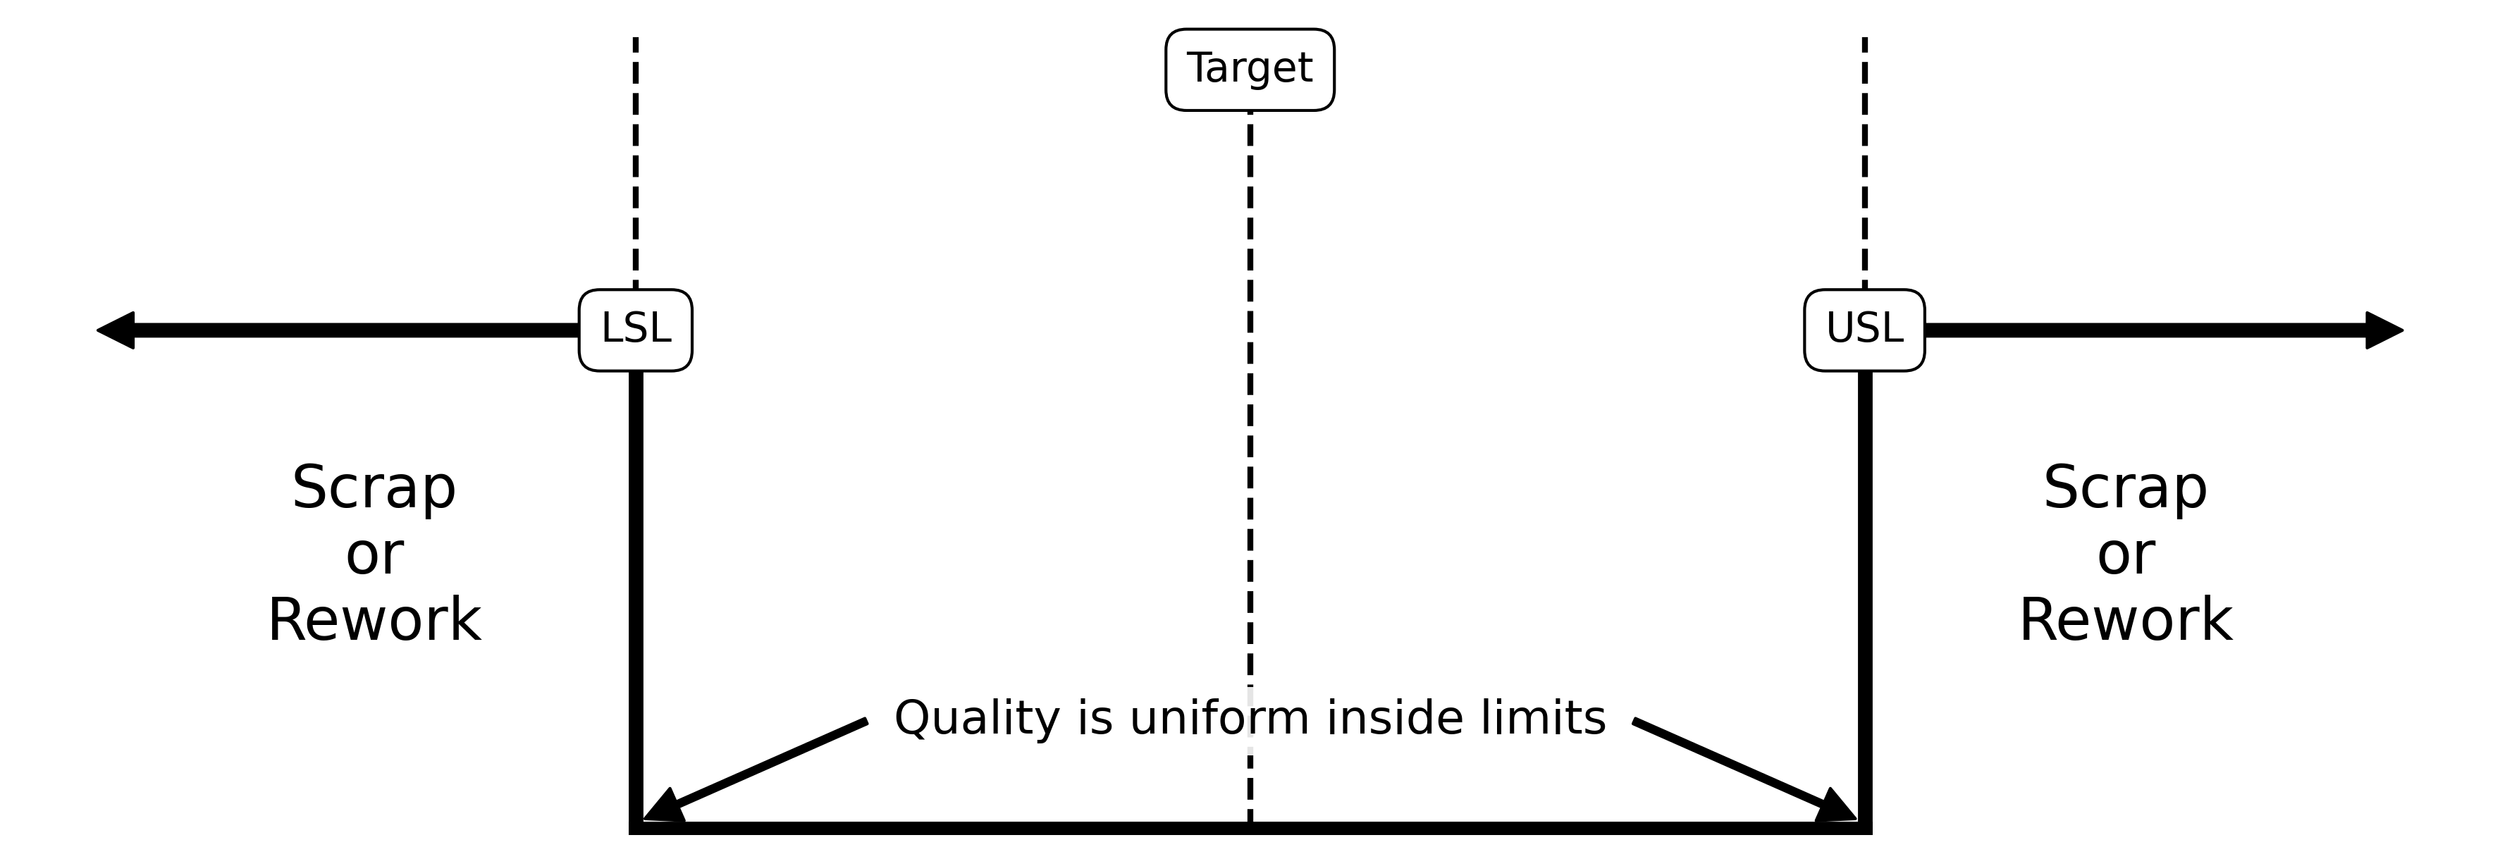
Want to learn how to produce products of world-class quality?
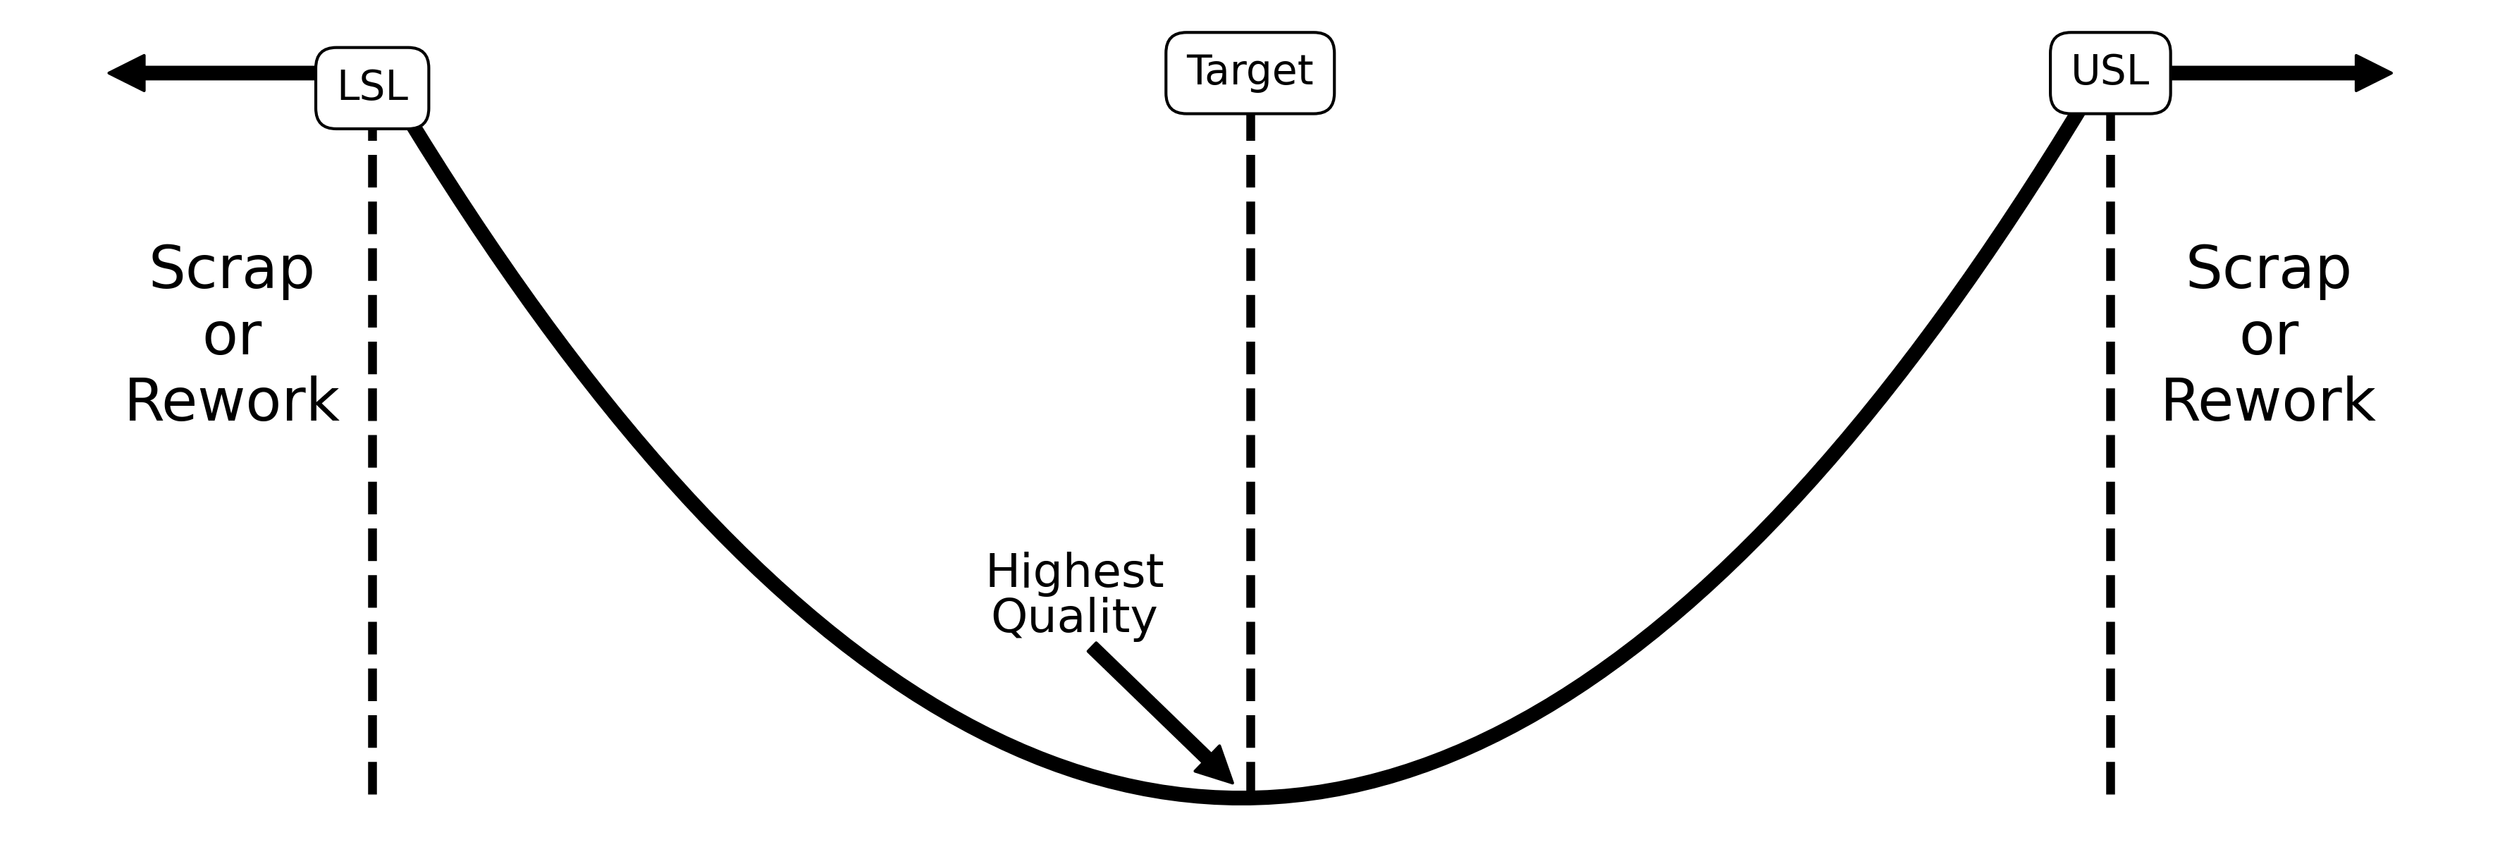
Since September of 1960, the Taguchi loss function has been the answer!

“The process principle states that the sequential outputs of a process are subject to some degree of difference, whether we can measure those differences or not.”
— Jim Lehner, The Virus of Variation: Making Sense of Death & Data Using Process Behavior Charts
The challenge of manufacturing
For as long as we’ve been making things, we’ve made efforts to make things the same. And yet, even with all our efforts, differences persist. Why is that and how can these seemingly unavoidable differences be overcome? This is the challenge of manufacturing.
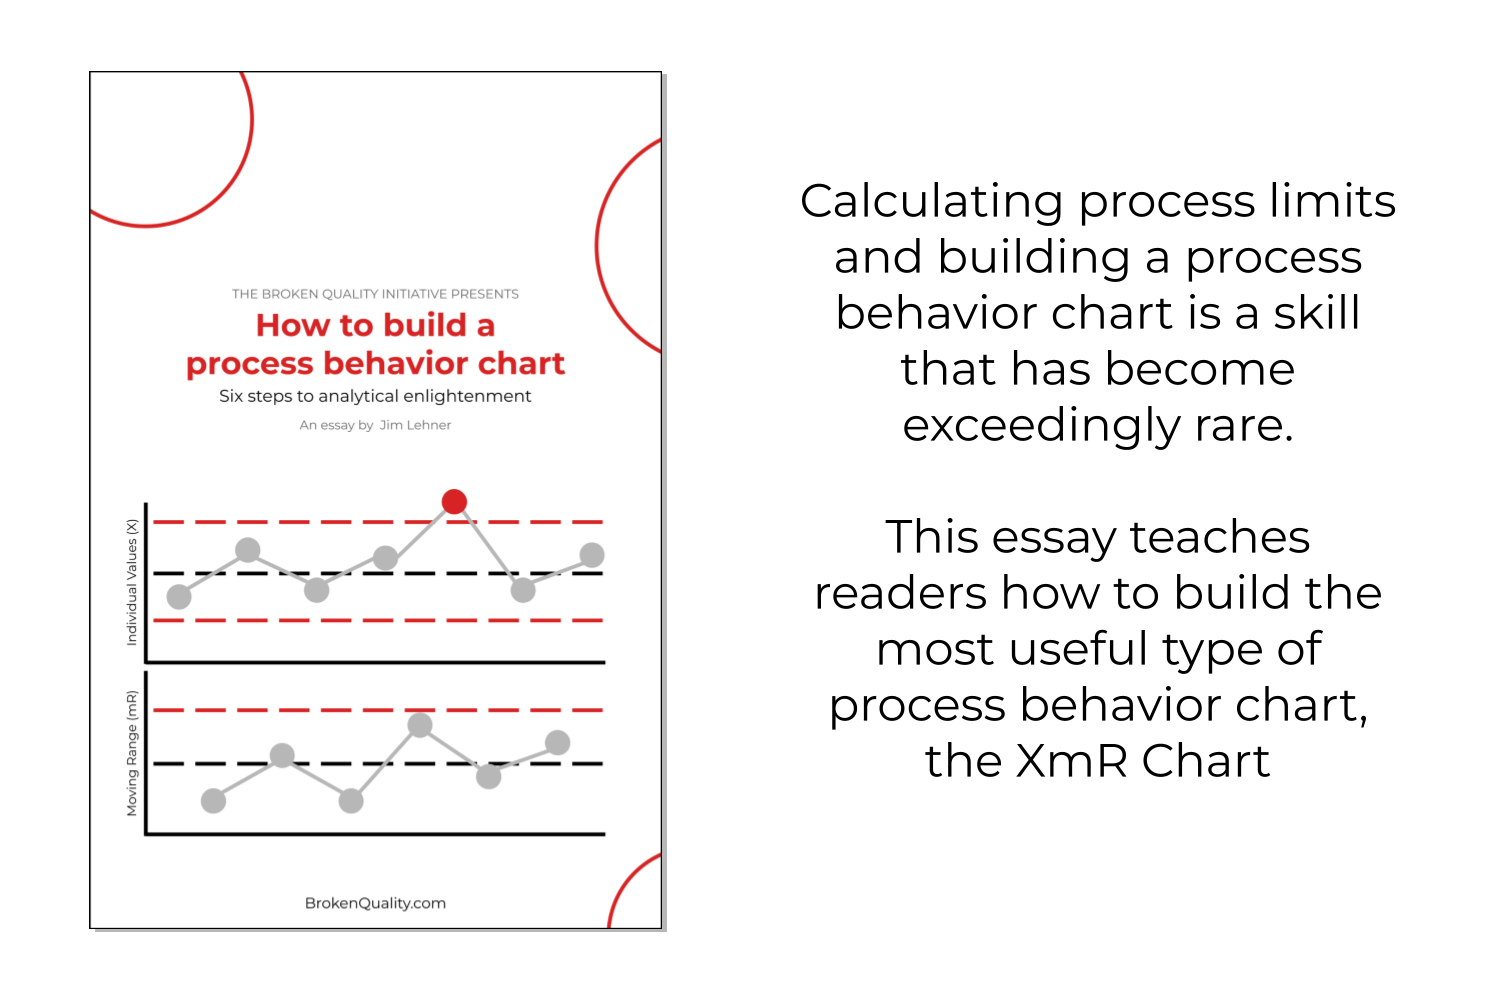
How to build an XmR chart
Understanding variation is only possible when you know how to build process behavior charts. In this six-step guide, you’ll learn how to build the Swiss Army knife of process behavior charts: the XmR chart.

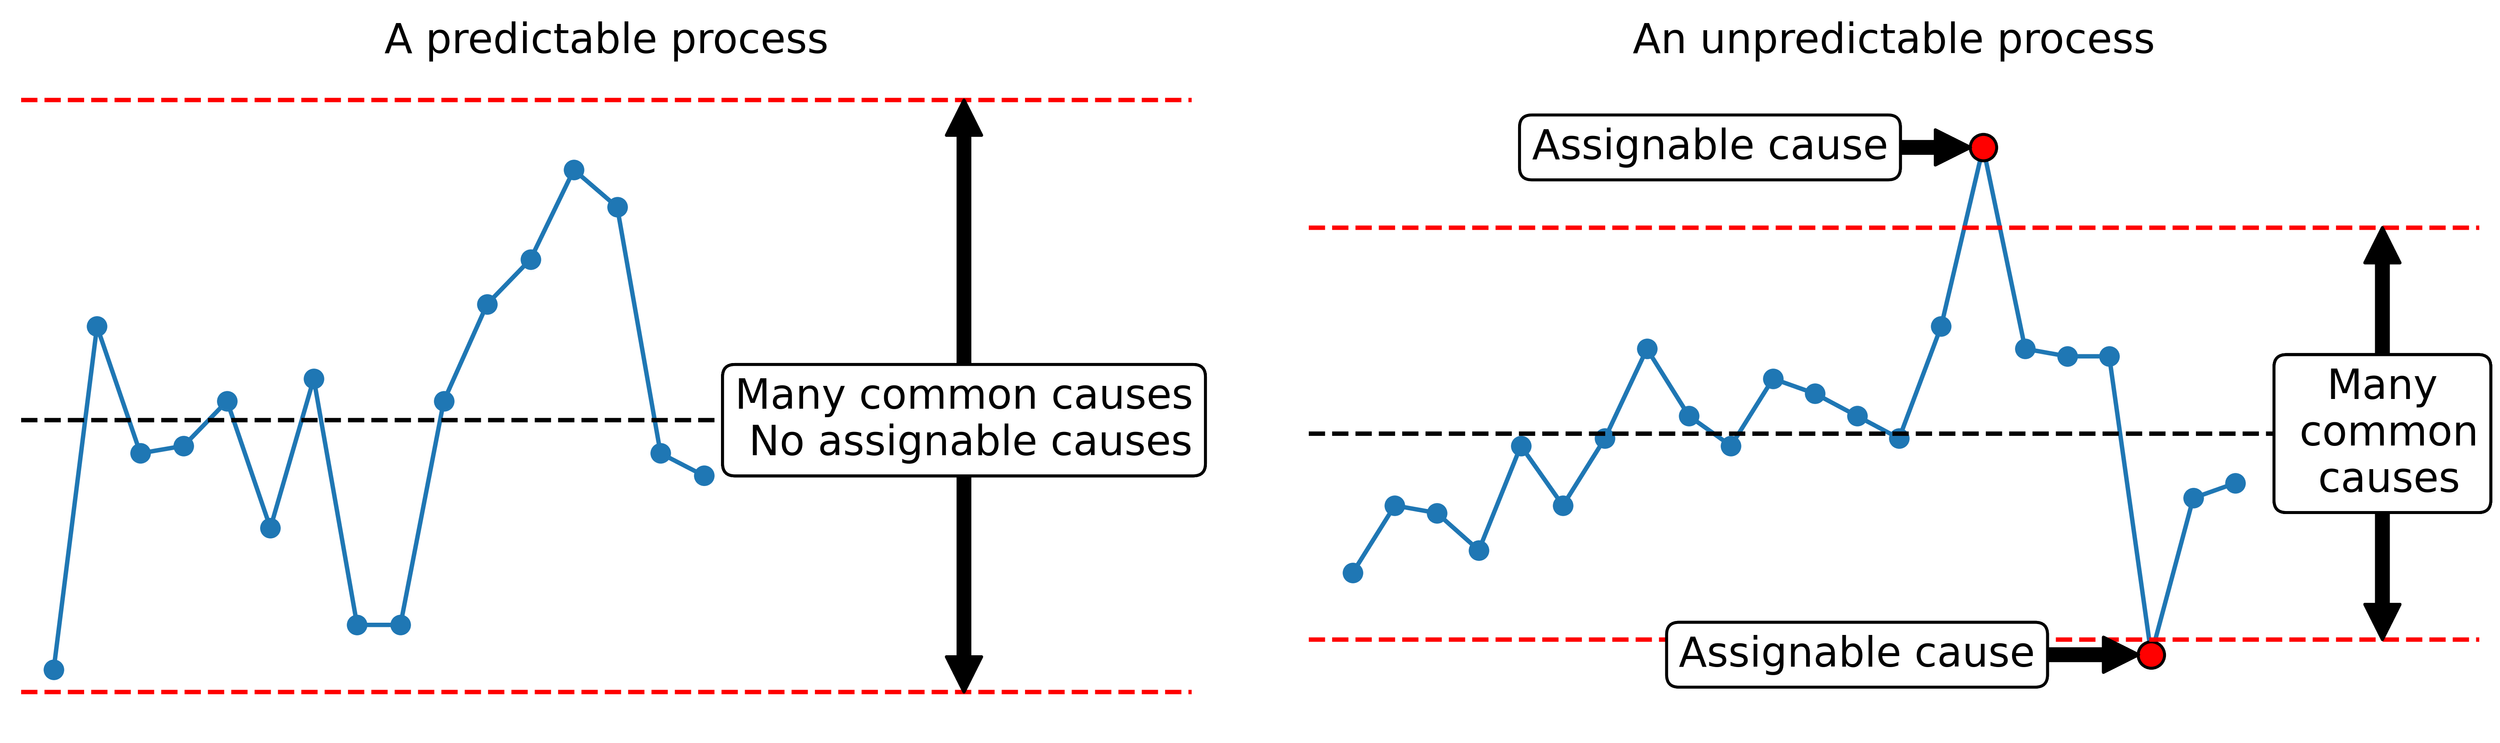
Characterization
Characterization is the task of determining if future process behavior can be predicted within limits. If it can, a process is characterized as predictable. If it cannot a process is characterized as unpredictable. Do you know what conditions satisfy each characterization?
“The job of a manager is to work on the system, to improve it, with the help of the workers.”
— Myron Tribus, The Germ Theory of Management