The Fix: Data, Insight, Action
Fixing quality specifically and manufacturing generally is a single job composed of two parts: theory and practice.
Theory requires knowledge of variation. Specifically, it requires the recongition that variation is an unavoidable feature of making things and manifests in two forms: common causes of routine variation and assignable causes of exceptional variation. Without the knowledge of variation, improvement efforts look in the wrong places and ask the wrong questions. They rely on luck, rather than analysis. While it never hurts to be lucky, luck, like hope, is not a method. To solve problems and run a business, requires a plan. Knowledge of variation provides the framework for that plan.
Of course, theory without practice is worthless because practice is where theory gets to work.
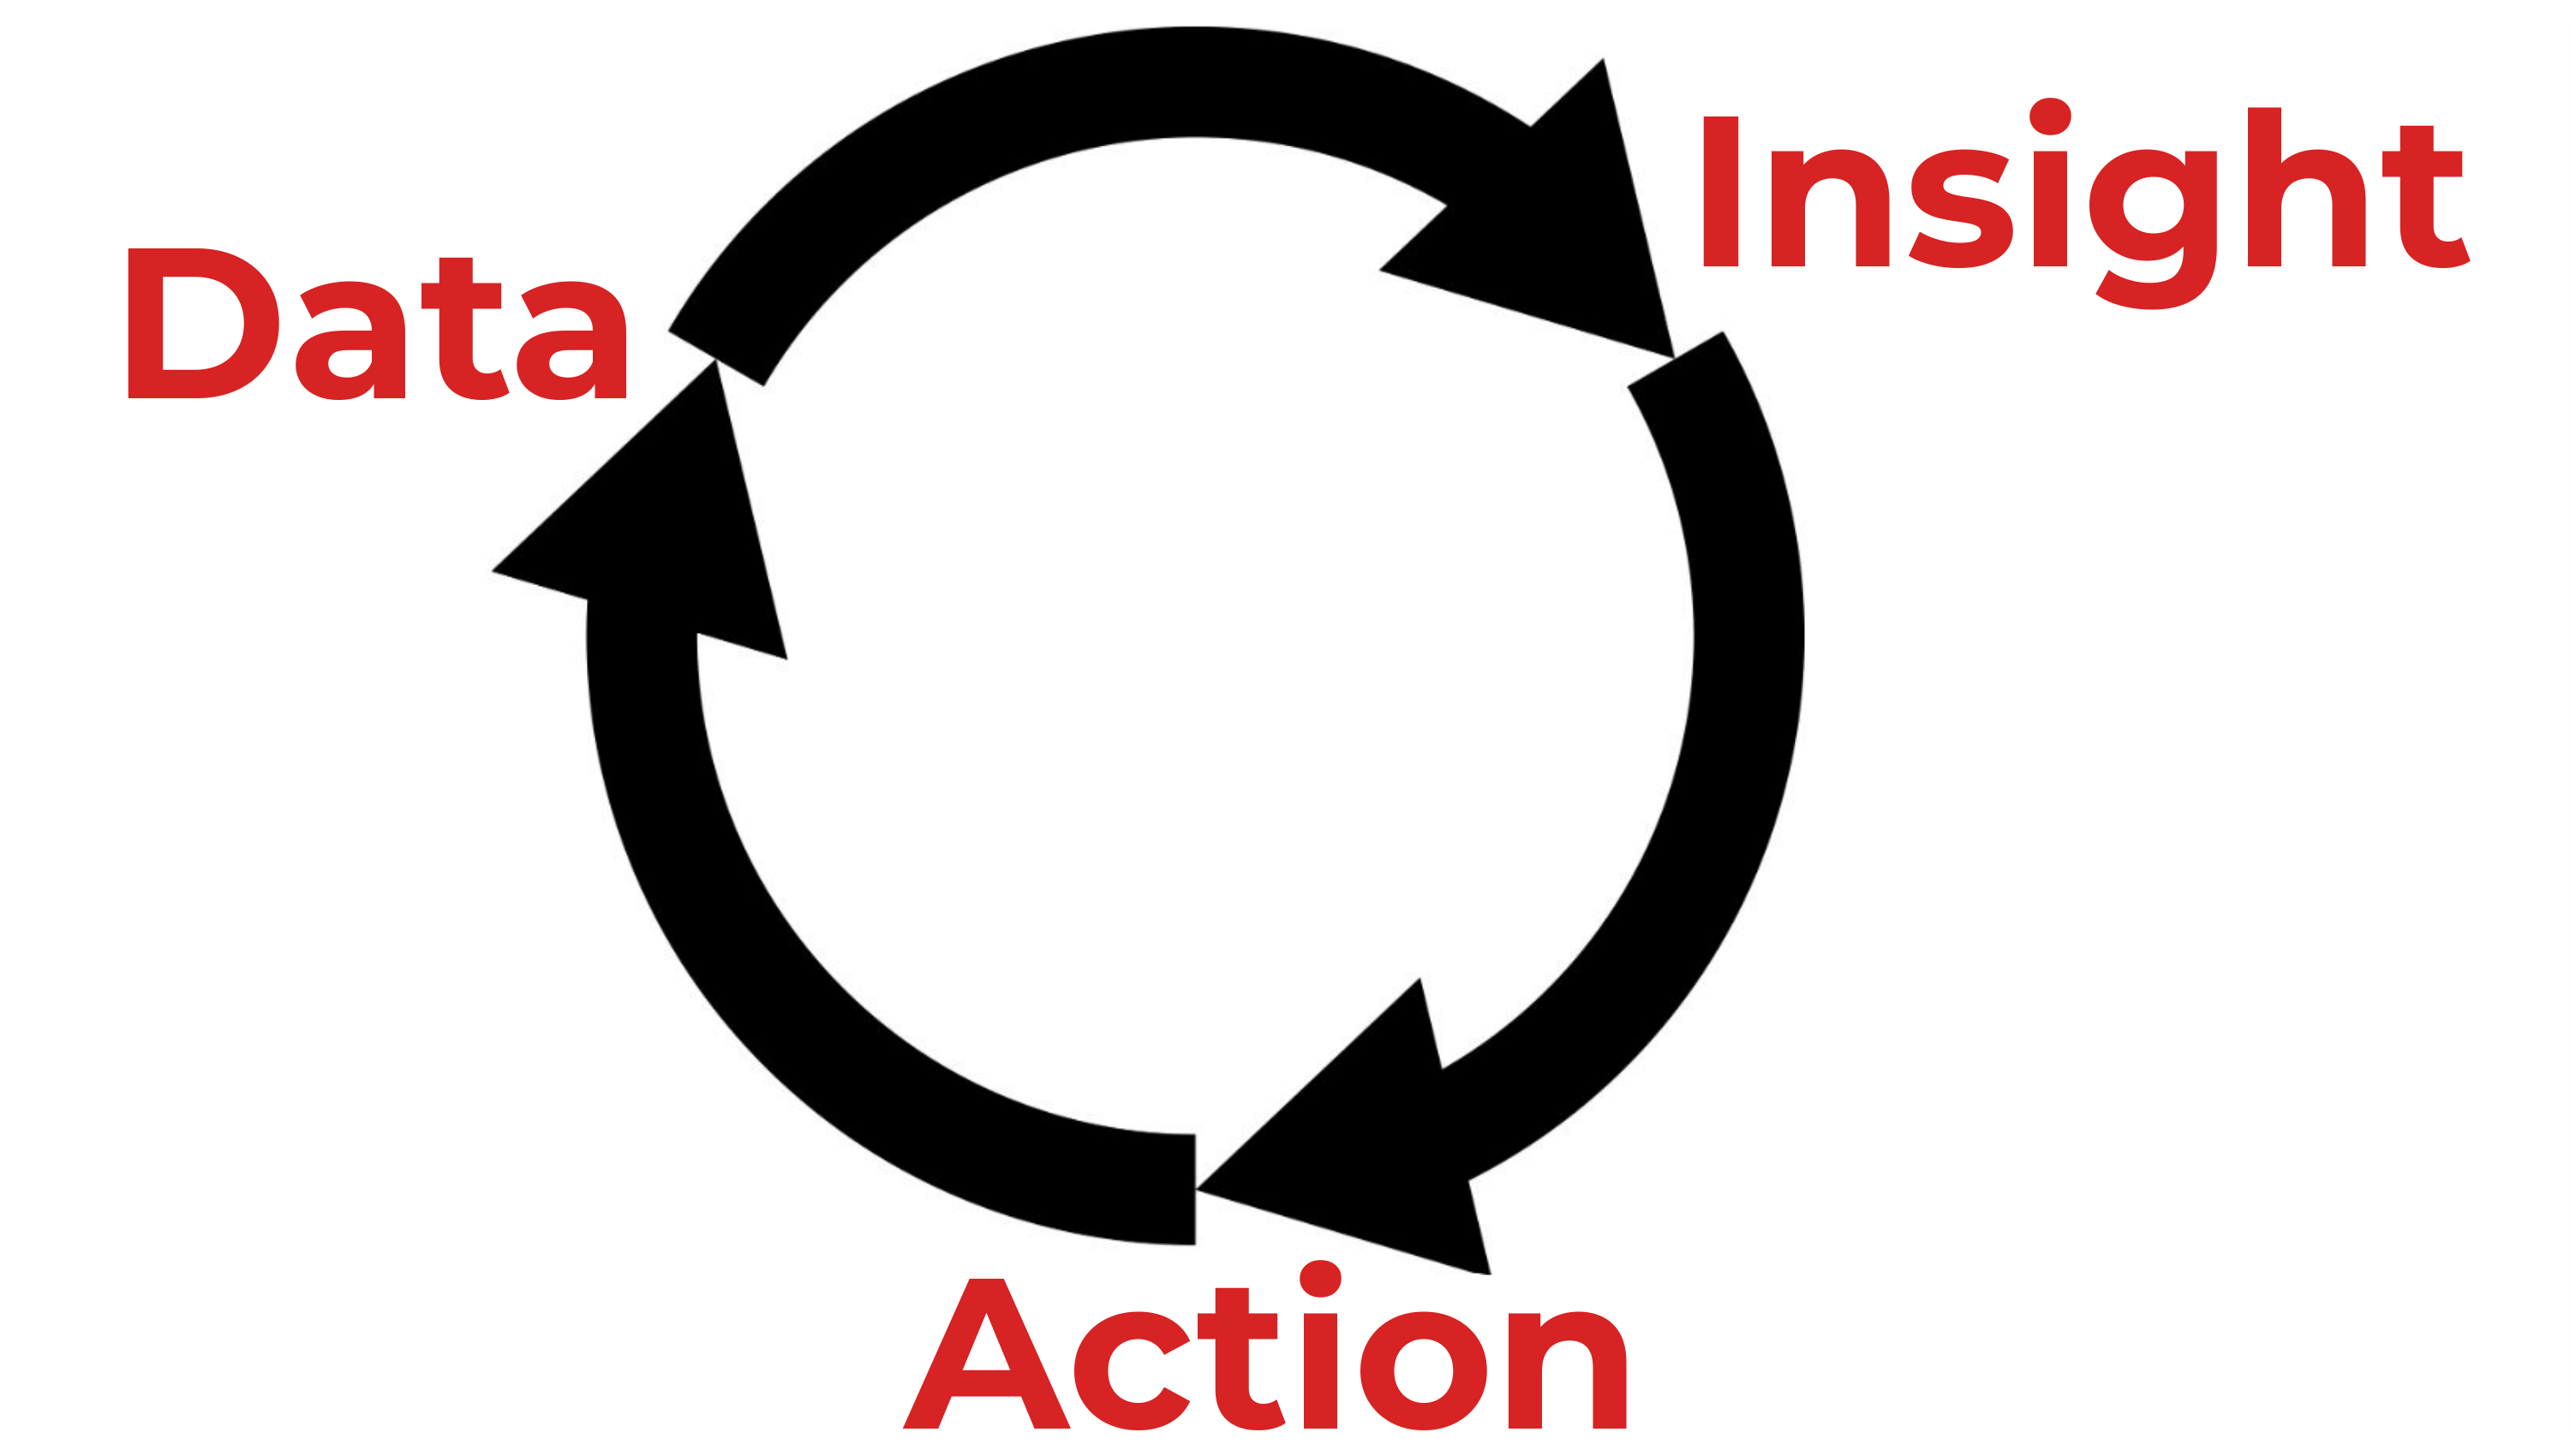
Putting theory to practice is best expressed throught the Data, Insight, Action cycle. This cycle prioritizes the analysis of process data to make the otherwise hidden world of variation visibile. Once visible, the insights of process behavior charts reveal the kinds of variation that influence process behavior and how to respond accordingly. This enables targeted and thoughtful actions that challenge preconcieved notions about process behavior and reveal underlying causal mechanisms. It results in a symbiotic relationship between theory and practice where one cannot exist without the other.
In support of the above framework, The Broken Quality Initiative has developed a system that addresses the failures of quality and manufacturing as it is practiced today.
The first leg of this system prioritizes numerical literacy and teaches students how to make sense of data. This is achieved by dividing the data landscape into two broad classifications: experimental data and observational data. This distinction leads to discussion about the two types of studies (experimental studies and observational studies) and the way of thinking associated with each. With these distinctions in hand, subsequent discussions explore how the tools of statistics and Statistical Process Control (SPC) are distinct, even though they borrow from each other. They explore how, in the words of the American statistician and quality control expert Donald J. Wheeler, two things sharing a common name can still be different.
“Numerical literacy is not addressed by the traditional courses in the primary or secondary schools, nor is it addressed by advanced courses in mathematics. This is why even highly educated individuals can be numerically illiterate.”
— Donald J. Wheeler, Understanding Variation: The Key to Managing ChaosThe second leg of this system teaches an understanding of variation. It explores seminal questions such as:
- What is the purpose and aim of manufacturing?
- What is variation?
- How do we define quality?
These theory focused discussions create an understanding of variation that can be applied to real world problems. They provide students with a new way to think and approach manufacturing. Under this new way of thinking, the aim is to produce products that are virtually uniform instead of simply meeting specifications.
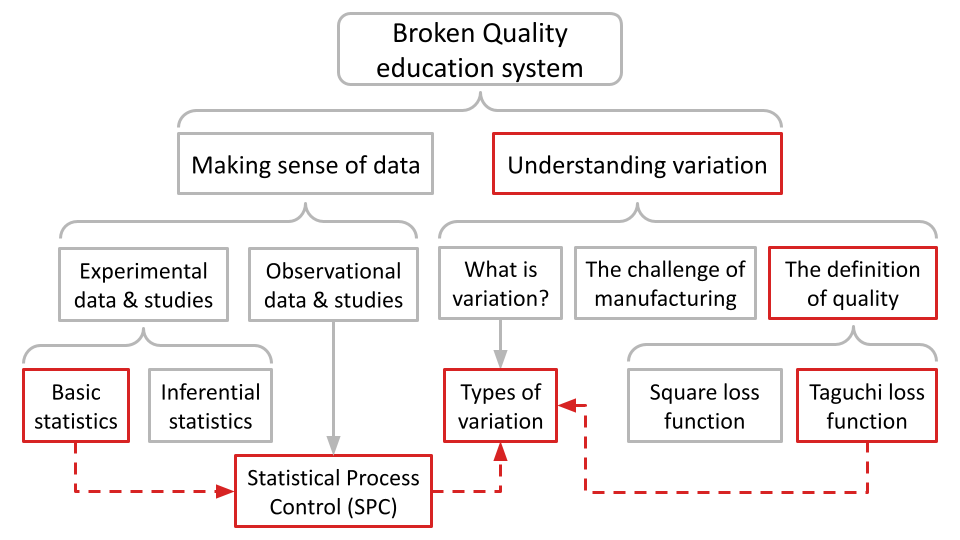
The theory and ideas discussed in the two legs of our educational system are underpinned by practice. This practice is facilitated by spreadsheet software like Google Sheets and Microsoft Excel, and programming languages like Python. It challenges students to spend time with the data-generating process (DGP) and perform the required detective work. This puts them in the proverbial driver seat. It ensures that the new way of thinking cultivated by exposure to theory is reinforced by doing. Without this rubber meets the road approach, the growth and development that comes from doing, failing, refining, and doing again remains out of reach.
The Broken Quality Initiative is always looking for opportunities to partner with educational organizations and speak with students. If you would like to discuss our framework and system further, send us a message via the form below or email us at QualityIsBroken@gmail.com.